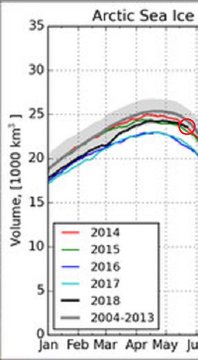
The current #Arctic sea ice volume has exceeded that of 2014, and is now at a five-year high.
ʕ´•ᴥ•`ʔ
DMI:http://ocean.dmi.dk/arctic/icethickness/anim/plots_uk/CICE_combine_thick_SM_EN_20180523.png …
~#地球温暖化? #温暖化? #気候変動 #GlobalWarming?
Solar Activity Only 28% Of Normal & Arctic Sea Ice Volume Greater Than 2014!
The sun was inactive in April, as we currently find ourselves in the minimum between solar cycle (SC) 24 and the coming solar cycle 25. The recorded mean sunspot number (SSN) for April was 8.9, which is only 28% of what is usual 113 months into a solar cycle.
In April, 16 days were spotless. The following chart shows sunspot activity:

Figure 1: Plot of the monthly sunspot activity for the current cycle (red) compared to SC 5 (black) and the mean of the previous 23 recorded cycles (blue).
Next what follows is a chart of the sunspot activity, as measured by satellite. As spot activity rises, so does total solar irradiance (TSI):

Figure 2: Total solar irradiance (TSI) at mean Earth distance since 2004, (source here). The rise of 1.5 W/m² between minimum and maximum is clearly observed and translates to approx. 0.4W/m² atmospheric effective fluctuation.
The chart above illustrates the relationship between sunspot activity and TSI. The sharp peaks of greater than 3 W/m² show the effects of large sunspots that darken the sun’s surface.
The question that arises: “Why does TSI increase when there are dark spots?“ This can be answered when the spectral share of the ultraviolet range is accounted for. When dark spots appear, there is a greater source of UV light (faculae), which overcompensates for the visible light.
Figure 2 above also shows us that we reached a minimum in 2018.
The following chart, Figure 3, is a comparison of the solar activity of all the previous solar cycles recorded thus far since 1755:

Figure 3: The accumulated monthly sunspot anomaly until 113 months into the cycle. The current solar cycle has been well below the mean in activity and is the weakest in close to 200 years since SC 6.
Arctic sea ice volume greater than 2014
Meanwhile, the Earth’s surface has cooled since the last powerful El Nino ended, and thus could be having some effect on Arctic sea ice.
Japanese climate skeptic and blogger Kirye tweeted yesterday that Arctic sea ice volume has in fact exceeded the level seen in 2014 and is now just somewhat below average, and so fully within the range of natural variability:
Arctic sea ice volume has been falling only slowly this spring and is now higher than 2014 levels.
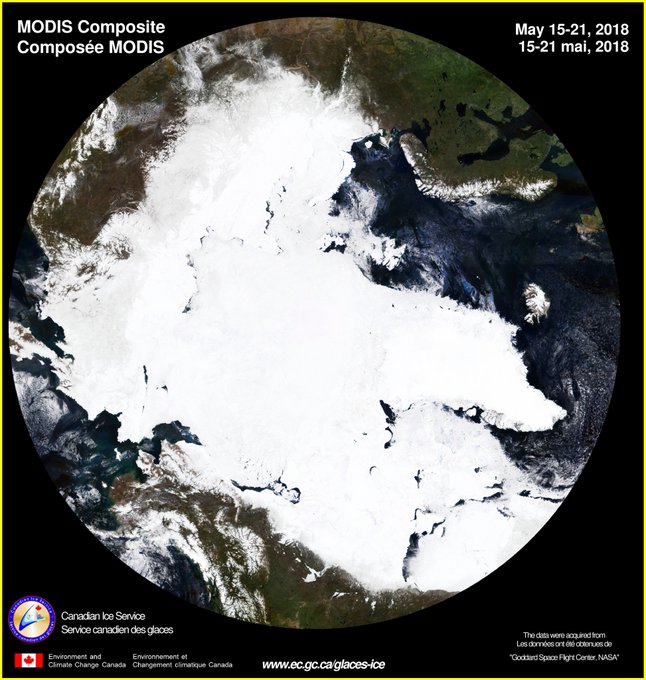
Also, a satellite image of the northern hemisphere ice cap presented by Pure Climate Skeptic at Twitter shows widespread snow and ice:
Read more at No Tricks Zone
Trackback from your site.


tom0mason
| #
I sincerely hope this is not the start of a trend, as increasing global ice does not bode well and may indicate a return to a cold period.
Reducing global ice amounts is a good indicator that this planet is still moving out of the deadly LIA and towards the good times of climate warmth and food abundance. This planet has only warmed by about 1°C since the end of the LIA.
However the climate’s long term progression is at the command of the sun and with reducing solar activity a cooling event, with all the concomitant political, social, and biological stresses that brings, is more likely than not. Hopefully it will be a brief and shallow cooling event.
Reply