Polar Bear Habitats see more Ice in 2017 than 2006
It’s just an observation but NSIDC Masie ice charts show 14.7 mkm2 of sea ice for 2017 at 19 February (Day 50) but only 14.3 mkm2 for 2006 (see them copied below).
In contrast, the NSIDC interactive graph shows almost the opposite: 14.3 mkm2 for 2017 and 14.4 mkm2 for 2006 (but with both below 2 standard deviations of average).

Different treatment of ice concentration values probably account for much of the differences and it doesn’t mean much.
But it needs to be pointed out while sea ice is lower than average this year, sea ice coverage was also below average in 2006 – and there was not a huge die-off of polar bears that year as a result.
There is no evidence that polar bears require “X” amount of sea ice in late winter or spring. Anyone who suggests otherwise is making things up.
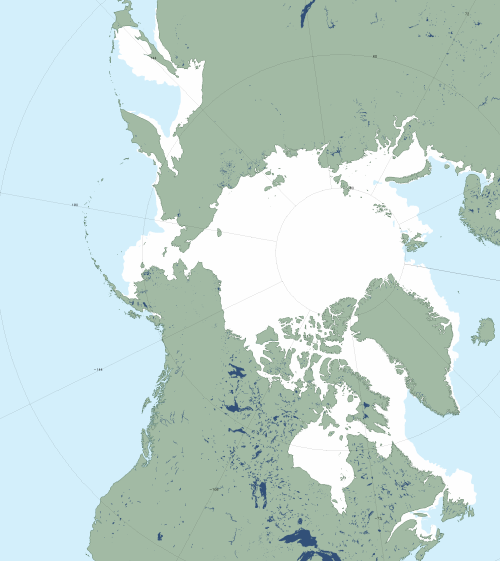
Here is Masie 2017 for day 50 (cropped), 14.7 mkm2:
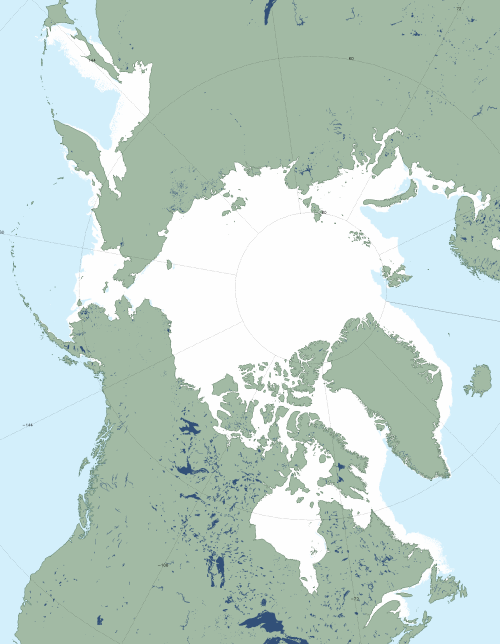
Below is Masie 2006 for day 50 (cropped), 14.3 mkm2:
Read more at
Trackback from your site.